Posts
 https://www.1gabe.com/wp-content/uploads/2017/10/Climbing-Protection-Rack-Optimization.jpg
882
979
Gabe DeWitt
https://www.1gabe.com/wp-content/uploads/2016/07/Gabe-DeWitt-Logo_Large-300x225.png
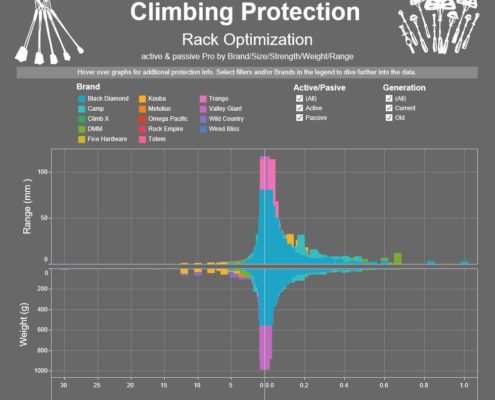
Gabe DeWitt2017-10-04 20:55:532017-11-29 21:07:10Climbing Data- Rack Optimization
https://www.1gabe.com/wp-content/uploads/2017/10/Climbing-Protection-Rack-Optimization.jpg
882
979
Gabe DeWitt
https://www.1gabe.com/wp-content/uploads/2016/07/Gabe-DeWitt-Logo_Large-300x225.png
Gabe DeWitt2017-10-04 20:55:532017-11-29 21:07:10Climbing Data- Rack Optimization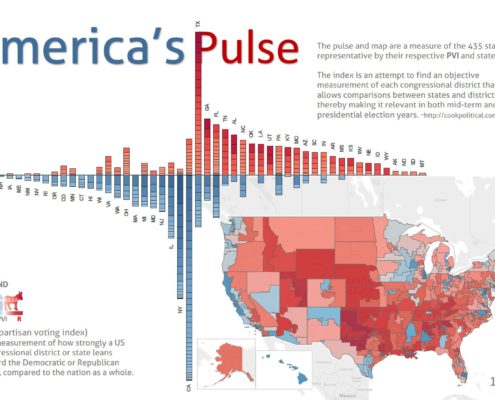 https://www.1gabe.com/wp-content/uploads/2016/11/America-Pulse-PVI-by-State-Election-2016-by-Gabe-DeWitt_rev2.jpg
1109
1811
Gabe DeWitt
https://www.1gabe.com/wp-content/uploads/2016/07/Gabe-DeWitt-Logo_Large-300x225.png
Gabe DeWitt2016-11-05 18:17:502016-11-06 22:05:30America's Pulse
https://www.1gabe.com/wp-content/uploads/2016/11/America-Pulse-PVI-by-State-Election-2016-by-Gabe-DeWitt_rev2.jpg
1109
1811
Gabe DeWitt
https://www.1gabe.com/wp-content/uploads/2016/07/Gabe-DeWitt-Logo_Large-300x225.png
Gabe DeWitt2016-11-05 18:17:502016-11-06 22:05:30America's Pulse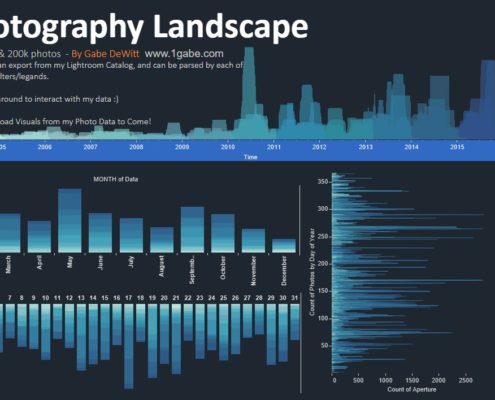 https://www.1gabe.com/wp-content/uploads/2016/08/Photography-Landscape-Tableau-10-Dashboard.jpg
708
1218
Gabe DeWitt
https://www.1gabe.com/wp-content/uploads/2016/07/Gabe-DeWitt-Logo_Large-300x225.png
Gabe DeWitt2016-08-19 05:39:262016-08-19 12:27:32Photography Landscape - Analytics Dashboard
https://www.1gabe.com/wp-content/uploads/2016/08/Photography-Landscape-Tableau-10-Dashboard.jpg
708
1218
Gabe DeWitt
https://www.1gabe.com/wp-content/uploads/2016/07/Gabe-DeWitt-Logo_Large-300x225.png
Gabe DeWitt2016-08-19 05:39:262016-08-19 12:27:32Photography Landscape - Analytics Dashboard